
How To Choose An Investment
/There is a vast sea of investment information out there— so much information, in fact, that it can be tough to know where to look. This post is going to tell you about the few key pieces of information you need to check before buying an ETF/Index or Mutual Fund and were to find that information on the internet. Let's start with some screen shots from BlackRock's iShares S&P 500 Index, a popular ETF that has received a lot of attention in recent years.* Here's the header at the top of fund's web page—I've add the yellow comments to help things along:
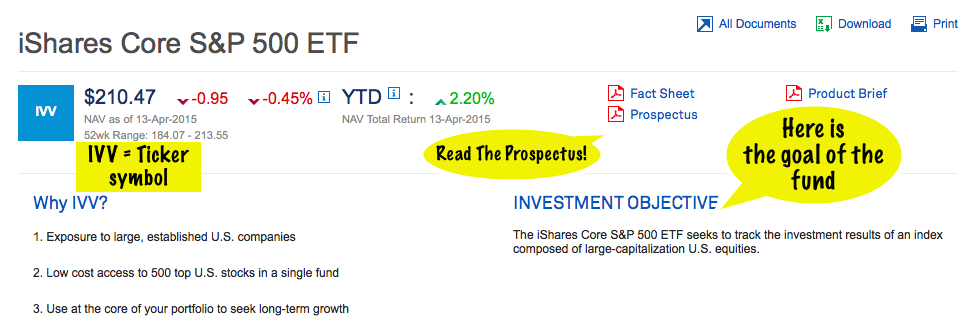
Investment Objective
Ignore the price quotes with the pretty green and red arrows and look for the "Investment Objective." This tells us the goal of the fund, and it means you can immediately rule out funds that don't fit into your strategy regardless of where the arrows are pointing.
In this case, we are looking at a true index fund—the whole purpose of it is to invest in all or most of the large capitalization companies that make up the S&P 500. If you are trying to find a way to invest in a broad range of large U.S. companies, this might be right for you. But there are all sorts of other objectives out there. You will find funds trying to track small U.S. or international companies, track only energy companies, blend stocks and bonds, minimize taxes, minimize risk (i.e. "low volatility" funds) or even maximize risk in the search for higher returns. Just make sure the goal of the fund matches your goal as an investor.
And before you actually make a purchase, be sure to download and read that prospectus—fund companies are required by law to provide it to you.
Performance and Benchmarks
Assuming the objective matches yours, your next glance should be at performance. Online fund charts now often provide you up to the minute information on the fund's price, and the chart is almost always set to show you only the last year (and often, only the last day). A fund's past success never means that you can count on it to perform in the future, but the fund's performance over the past year is especially useless. Click on the 10 year (10Y) option to see how the fund has done over a much longer timeframe. And crucially, compare your fund's performance to its benchmark.
What is the benchmark? The benchmark will be the market index that best matches up with the fund's investment objective. If the fund tracks bonds, it will be a bond index; if it tracks technology companies, it should be a technology index. The benchmark gives us a better idea of how well the fund is doing at what is designed for.
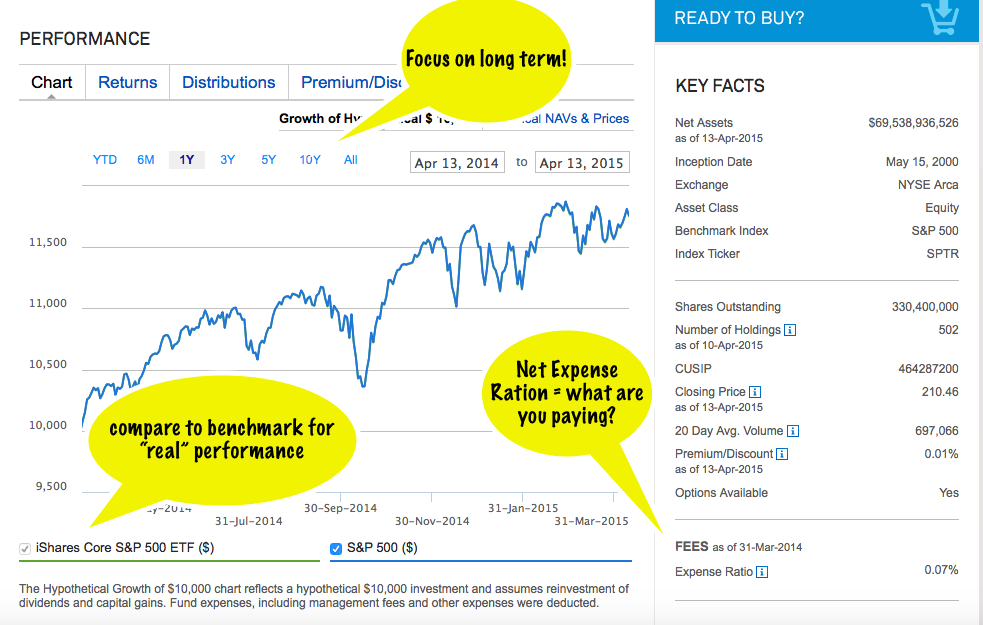
Fees: What are you paying?
Investors routinely miss this little statistic (I couldn't even find it on Google Finance or Yahoo Finance's page for IVV), but this one is a big part of your decision. The Expense Ratio will be a percentage, and it tells you how much of the money you put into the fund will go to paying for fund management fees every year. To find out what you personally will be paying every year to own the fund, multiply the percentage by the amount you plan to invest.
In this case, I've chosen to show you one of the least expensive funds out there—you won't find many this cheap. Mutual funds on average range between 1 and 2%, while Index Funds average somewhere around .5% (it takes more work to manage a collection of stocks than have your computer track an index!).
You will find plenty of cases where two funds with similar holdings and objectives vary wildly in price, so make sure you aren't losing you money to management fees right off the bat.
Holdings and Risk
Now let's look at the bottom of the fund profile page:
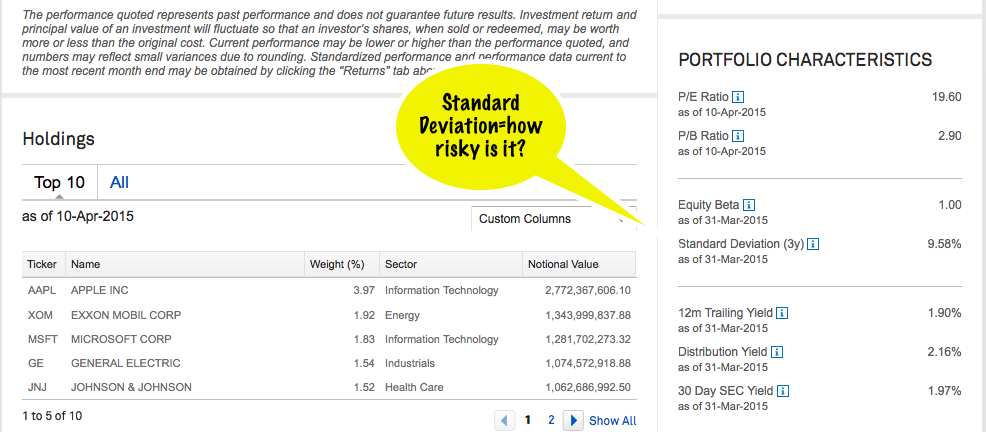
If the fund has been clear and accurate with it's objectives, the holdings list at the bottom should not come as a surprise, but you should always take a quick glance at what you are buying. Does it overlap a lot with another fund you own? That's a warning sign that you may be paying for two funds where you only need one.
Now note the "Standard Deviation." This number will be a percentage, and it is meant as a quick indicator of how volatile the investment is likely to be—how much it's price will go up and down. Here we see that IVV's standard deviation is 9.58%, which is not coincidentally about the same deviation as the S&P 500 Index. Don't worry too much about how this number is calculated, just know that 9.58% puts IVV in the middle of the pack (deviation-wise) for publicly traded funds. At the riskier end are things like emerging markets, which might have standard deviations around 20% and "low" or "managed" volatility funds, which might have standard deviations of only 3% to 4%.
Standard Deviation is not the only indicator we use to determine whether an investment is risky (other common measures of riskiness include alpha, beta, Sharpe ratio, and R-Squared), but it does give the average investor some warning about how much an investment's price is likely to swing up and down.
One More Factor To Consider
If you are looking at a mutual fund, rather than an ETF, you may have to contend with minimum investments, especially if you are buying within another investment company. Check the sidebars of your fund profile to see if there is a minimum. And if you do see one, but like the fund, check the fund company's own website to see if it available directly through them without minimums.
*note that this does not constitute an investment recommendation for any of you out there—just an investment example.